Group’s all-round good performance in line with five-year growth targets
- Profit After Tax and Minority Interests (“PATMI”) rose 49% to S$931.7 million
- Strong Return on Equity (“ROE”) of 12.8%, Return on Invested Equity (“ROIE”) of 14.6%
- Total owned and managed real estate assets (“AUM”) scaled up to S$21.8 billion
- Total cash and undrawn facilities of S$4.5 billion, of which cash and cash equivalents amounted to S$1.7 billion
- Net gearing level reduced to near zero
| Key Financial Performance Highlights For FY2012/2013 | |||
| FY2011/2012 | FY2012/2013 | CHANGE | |
| Revenue | S$574.4 million | S$686.3 million | + 19.5% |
| PATMI | S$625.8 million | S$931.7 million | +48.9% |
| Return on Equity (ROE) | 9.7% | 12.8% | +32.0% |
| Shareholder’s Funds | S$6,691.4 million | S$7,508.7 million | +12.2% |
SINGAPORE – Mapletree Investments Pte Ltd (“Mapletree” or “the Group”), a leading Asia-focused real estate development, investment and capital management company, posted robust results for the financial year ended 31 March 2013 (“FY12/13”). Mapletree’s PATMI increased 49% from FY11/12 to S$932 million. This was underpinned by a broad-based increase in recurring core PATMI, investment & other gains1 and revaluation gains of its investment properties.
Group Chief Executive Officer Mr Hiew Yoon Khong said, “Mapletree’s FY12/13 results demonstrate both the continued execution of our business strategy and our commitment to deliver consistent and high returns. The Group’s financial performance further reflects the effectiveness of our business model – one that combines our real estate development expertise with investment and capital management capabilities. We have grown our total AUM to S$21.8 billion and lowered our net gearing to near zero. The Group is therefore extremely well-positioned financially for the next two to three years. With this performance, we have also achieved most of our five-year targets with one more year to go. More importantly, as the Group focuses on growing its scale, we hope to successfully increase or maintain our profitability.”
MAPLETREE’S FIVE-YEAR GROWTH TARGETS (FY09/10 – FY13/14)
| FY12/13 (Year 4) | Target (By Year 5) | |
| EBIT + SOA2 | S$664.4m | S$600m – S$1b |
| Fee Income | S$188.1m | S$200m – S$300m |
| Average ROIE | 16.0% | 10% – 15% |
| NAV CAGR3 | 11.4% | 12% – 15% |
| AUM4 | S$21.8b | S$20b – $25b |
| AUM Ratio | 3.3x | 2 – 3: 1 |
FY12/13 Performance Review
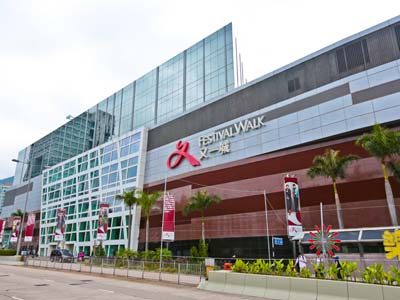
Mapletree’s real estate assets owned and managed or AUM grew almost 10% to S$21.8 billion and funds under management by 40% to S$10.5 billion. The Group continued to attain a healthy ROE of 12.8%, an increase from 9.7% the year before. This was mainly attributable to improved operating results, corporate restructuring surplus, divestment gains and revaluation gains. Improved rental revenue was driven mainly by increased occupancy of the Group’s flagship development, Mapletree Business City (“MBC”), as well as organic growth in Festival Walk arising from re-positioning and enhancing the retail mall’s offerings since Mapletree acquired the asset in August 2011. Another revenue contributor was fee income, which saw year-on-year increase of 40%, as it further delivers value to investors in its real estate investment trusts (“REITs”) and private funds. The Group enlarged its third-party AUM from S$11.4 billion as at the end of FY11/12 to S$16.7 billion at the end of FY12/13.
Capital Management
The Group’s capital management business was further strengthened with the public listing of its fourth REIT, Mapletree Greater China Commercial Trust (“MGCCT”). The initial public offering (“IPO”) of MGCCT was well-received with 29.5 times subscription. Raising over S$1.68 billion, the MGCCT IPO is the largest Singapore REIT IPO to-date. The listing of MGCCT creates a platform for stabilised commercial assets in Greater China and strengthens the Group’s realisation track record in China. Going forward, MGCCT will also provide incremental fee income of more than S$25 million per annum. All of Mapletree’s other REITs also delivered distributable income growth in FY12/13.
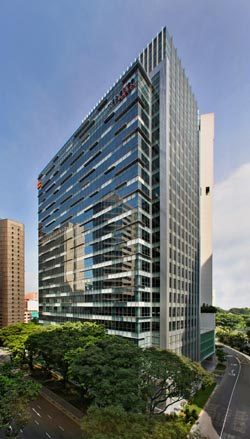
During the year, the Group recorded healthy investment & other gains. Mapletree divested Festival Walk and its sponsored private fund, the Mapletree India China Fund (“MIC Fund”) divested Gateway Plaza to MGCCT to form the REIT’s initial portfolio. The divestment of Gateway Plaza by the MIC Fund realised a gross internal rate of return of over 40% for investors of the private fund. Additionally, Mapletree Anson, which was developed by Mapletree and had reached an occupancy level of 95.6%, was acquired by Mapletree Commercial Trust for S$680 million.
Development Expertise
Mapletree continued to scale up and export its experience and expertise in developing and managing premium developments in Singapore to the region. The Group celebrated the groundbreaking of two large-scale development projects in China – the Mapletree Minhang Development Project and South Station Enterprise City. The former is a mixed office-cum-retail development, which will feature two Mapletree award-winning flagship brands, MBC and VivoCity. The project is strategically located within the fast-emerging Xinzhuang business centre in Shanghai’s Minhang District, while South Station Enterprise City, located in Foshan district, Guangdong, will offer 23 premium office buildings and is set to be the first and largest premium business development to be built within the Guangzhou South Railway Station economic circle.
Financial Resources
During the year, Mapletree established a US$3 billion Euro Medium Term Note Programme, providing the Group access to international debt capital markets outside the US for non-SGD issues, further diversifying funding sources. The Group issued S$600 million principal amount of 5.125% perpetual securities in July 2012, boosting its total equity to S$8.3 billion as of 31 March 2013.
With the listing of MGCCT and divestment of Mapletree Anson, the Group reduced its net gearing level to almost zero. Total cash and undrawn facilities as of 31 March 2013 was about S$4.5 billion, which will strongly position Mapletree to capitalise on any attractive investment opportunities in the next stage of growth.
1 Investment & other gains include corporate restructuring surplus or deficits, gains or loss on disposal, incentive fee (after tax), gains or losses on foreign exchange, fair value adjustments for financial derivatives and available-for-sale financial assets, negative goodwill and dilution gains or losses.
2 Earnings before interest and tax plus share of profits of associated companies and joint ventures
3 Net asset value compounded annual growth rate
4 Assets under management